Twitter Analytics for the Developers Conference in Mauritius
It was fun to build the Twitter statistics for the Developers Conference in Mauritius, but, it’s only today that I had the time to compile the figures for all 3 days and apply Sentiment Analysis on the individual tweets. Let’s look at the results!
Interactive Dashboard
Firstly, you can view the interactive dashboard here, filter the results, and even view details of the tweets.
Tweet Count
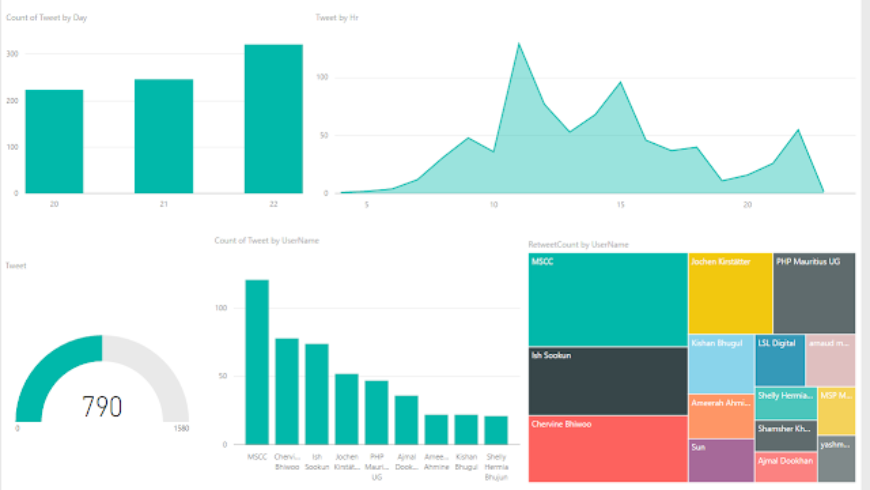
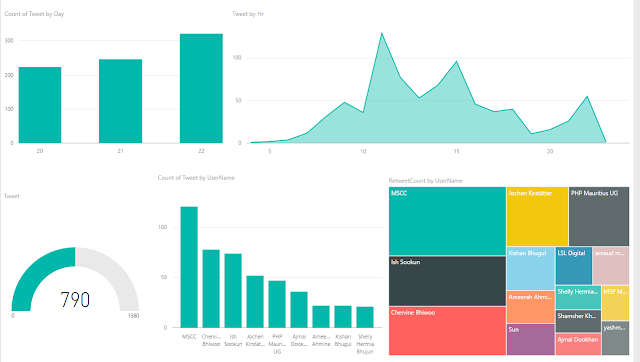
Count of Tweets: 790
Count of Tweets by Day: 20 = 223 ; 21= 246 ; 22= 321
People Tweet most between 11 – 12 Hr
Highest number of Tweets by Username is 121 (MSCC)
Twitter Username with highest number of ReTweets is MSCC with 259 RTs
Twitter Username with highest number of Favourites is Ish with 86 Favourites
Sentiment Analysis
Sentiment Score of each tweet is between 0 and 1 where 1 is the tweet with the most positive sentiment.
Sum of Sentiment Score was highest between 11 and 12 Hr.
Username with Highest of Sum(Score) is Ajmal
Average Sentiment Score was better on Sunday
Let’s do a filtering for PHP Mauritius UG and see the result.
PHP Mauritius is happier at around 14 and happiest on Sunday. Go ahead an play with the filters, it’s fun!
Tweets with highest sentiment score
 |
| click on the image to enlarge |
Tweets with lowest sentiment score
Seems that those who could not come to DevCon had the lowest sentiment score.
The algorithm failed for the coffee tweet. Anyway, it’s a machine doing the calculations, it won’t be 100% accurate.
 |
| click on the image to enlarge |
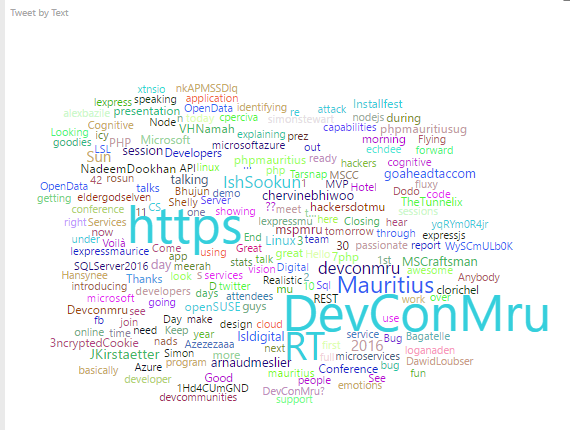
Most used words in tweets
DevConMru and https were the most used words. Note that common words like “the” were excluded
The technologies used are Power BI & Azure Machine Learning. Reach out to me to learn more about these Analytics tools!

